Monitoring unused CSS by unleashing the raw power of the DevTools Protocol

Update: Check out headless-devtools, a library for automating DevTools actions from code by leveraging the DevTools Protocol
Chrome DevTools is the go-to analysis tool for understanding what's going on under-the-covers of your app and conducting perf-audits. As you are interacting with the site like a real user would, you can use DevTools to drill-down to every tiny detail about the page.
This is great for manual analysis. But if your goal is to monitor web performance over time, you might find that tools in that space are not as powerful. Automated synthetic monitoring services don't expose nearly as much information as there is in DevTools, and for the most part the only type of user interaction they emulate is waiting for the page to load.
This post will show how you can create monitoring tools that are as powerful as DevTools by leveraging the DevTools Protocol, Puppeteer, and Headless Chrome. Using this approach you'll be able to automate any action you can perform manually in the DevTools UI. We'll demonstrate this technique by showing how to track the percentage of unused CSS in the app programmatically.
The challenge:
Calculate the real percentage of unused CSS
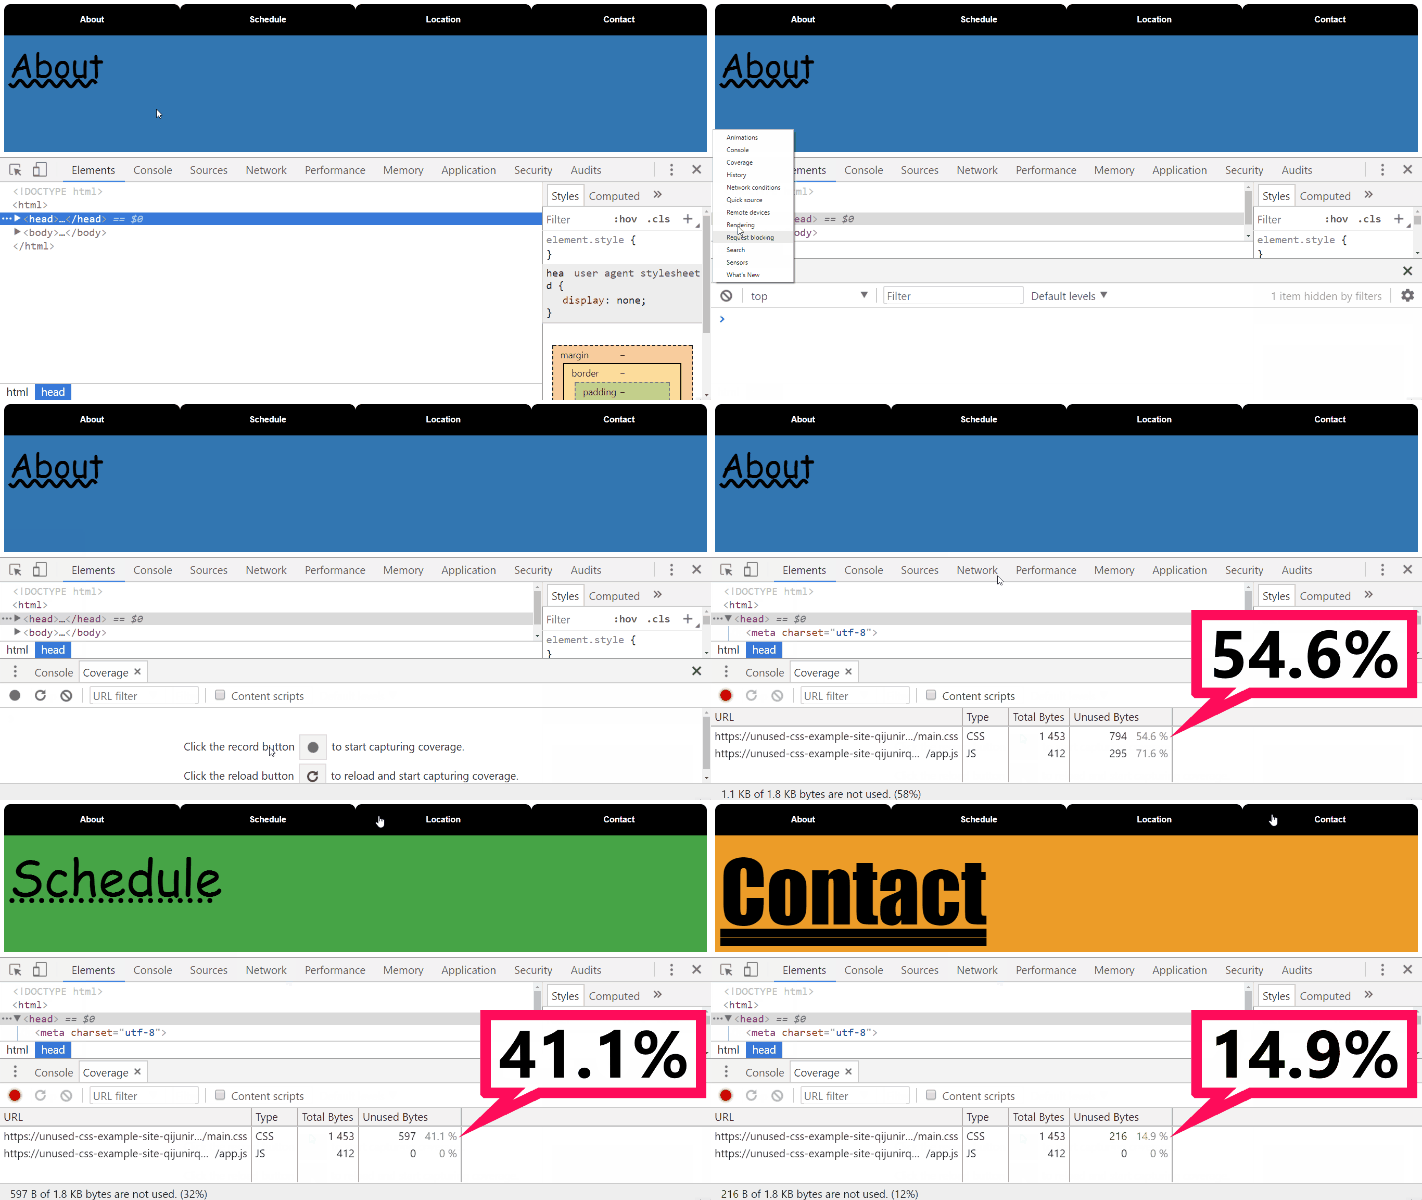
Our goal is to create a script that will measure the percentage of unused CSS of this page. Notice that the user can interact with the page and navigate using the different tabs.
DevTools can be used to measure the amount of unused CSS in the page using the Coverage tab. Notice that the percentage of unused CSS after the page loads is ~55%, but after clicking on each of the tabs, more CSS rules are applied and the percentage drops down to just ~15%. This is significant. We want our automated task to reflect this "real" percentage of unused CSS which means our script will have to mimic the user interaction and simulate clicking each of the tabs[1].
Step 0:
Meet Chrome without Chrome 👋
Headless Chrome is a new feature introduced in Chrome 59. You can now run Chrome in "Headless Mode" which means that no browser window is opened and the sites are rendered in-memory only. This new capability is perfect for testing and automation.
Like other headless browsers it can be used to automate user interaction with the page. But because it's Chrome, you can also use Headless Mode to automate DevTools actions as well. We'll use Headless Chrome in our automation to load and interact with the page while capturing CSS coverage. Headless Chrome can be controlled from code using the DevTools Protocol which we'll learn about next.

Step 1:
Spying on DevTools using DevTools 🕵️
Even though the DevTools UI looks similar to the rest of Chrome, it's actually a Single-Page-Application written with Web technologies. In fact it's available as a separate project you can download and tinker with. Since it's "just" a clientside application, it needs to fetch data about the inspected page from the Chrome instance. The DevTools frontend establishes a WebSockets connection with Chrome and the two exchange messages that adhere to the DevTools Protocol.
For example, if you would open up the Console tab in DevTools and type 1+1, these are the protocol messages that would be passed from and to the DevTools Frontend:
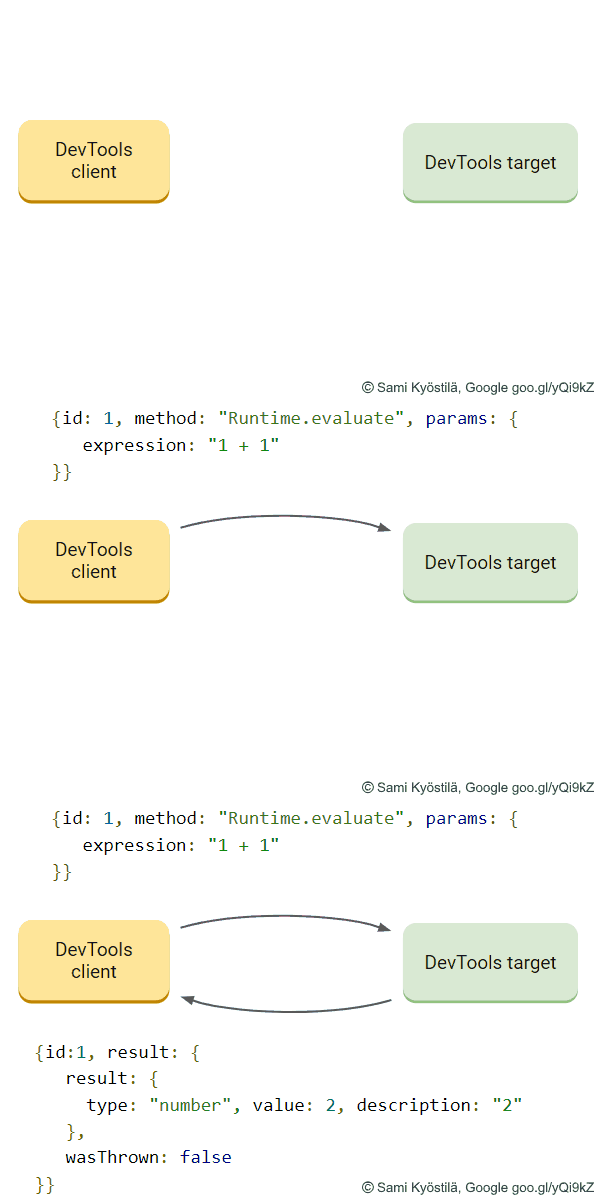
This is why we can be sure that any action we can perform manually in DevTools can also be triggered programmatically using the DevTools Protocol.
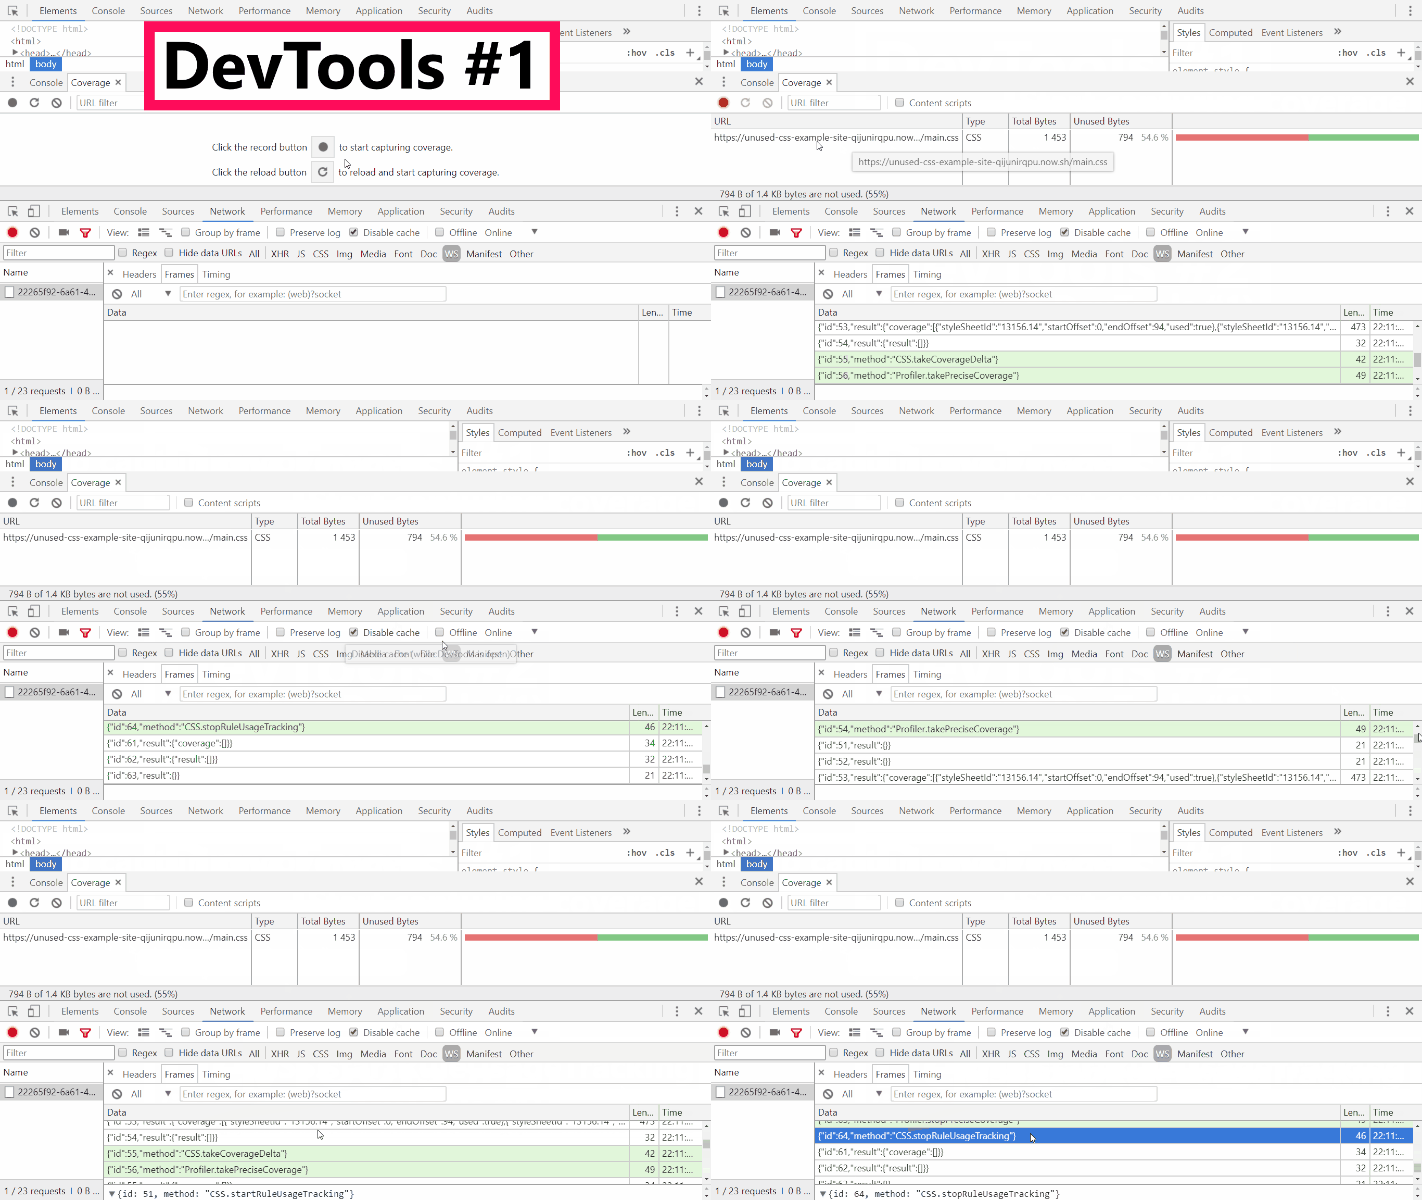
In order to create our unused CSS automation, we'll need to figure out which DevTools Protocol commands are sent when starting\stopping the tracking in the DevTools Coverage tab. Since we now know that the DevTools UI is actually a web page that's using WebSockets to send protocol commands, then one (fun!) way to achieve this is to use DevTools to spy on inspect DevTools![2] Here's how this is done:
- Launch Chrome with the
--remote-debugging-port=9222flag[3]. - Navigate to some web site (e.g.
unused-css-example-site-qijunirqpu.now.sh). - Open a new tab and navigate to
localhost:9222. - Choose the page from the first tab in the "Insectable pages" list.
You should land in a page that includes the DevTools UI inspecting the page from the first tab. We'll refer to this as DevTools #1. - Open up DevTools the way you usually do! (
cmd+opt+iorF12)
You should see an additional DevTools instance on the page that's inspecting the DevTools UI from step 4. We'll refer to this as DevTools #2. - In DevTools #2 go to the "Network" tab and select the "WS" filter.
- Refresh the page.
- In DevTools #2 click on the single WebSocket and go to the "Frames" tab.
- In DevTools #1, perform the action you want to find the matching protocol command for.
In our case this means open up the Coverage tab and start\stop capturing coverage. - Take note of which commands are sent\received via the WebSocket in DevTools #2[4].
In our case you should see that the method for starting the coverage tracking isCSS.startRuleUsageTracking, and for stopping the tracking it'sCSS.stopRuleUsageTracking. Eureka!
Step 2:
Putting it all together 🤖
Now that we know which DevTools Protocol commands we're going to use, we can get down to writing our automation script. The script is going to be written using Puppeteer, a node.js library for launching and controlling Headless Chrome. It's essentially a high-level abstraction on top of the DevTools Protocol. This is handy because automating simple user interactions with the DevTools Protocol can be quite tedious. For example, to simulate a user clicking a button using raw DevTools Protocol commands, you would need to find the coordinates of the element and trigger both mousePressed and mouseReleased events. Puppeteer takes care of all that when you use its click method.
When you do need to "get your hands dirty" with raw DevTools Protocol commands though, Puppeteer lets you do that as well[5][6]. This is why it's perfect to help us achieve our goal. We're going to use its handy abstractions to simulate the user clicking on each of the tabs, and then the ability to send raw DevTools Protocol commands in order to start\stop CSS tracking.
This is what the code looks like:
const puppeteer = require('puppeteer');

init();

async function init() {
  //Open Headless Chrome
  const browser = await puppeteer.launch();

  //Open a new tab
  const page = await browser.newPage();

  //Start sending raw DevTools Protocol commands are sent using `client.send()`
  //First off enable the necessary "Domains" for the DevTools commands we care about
  const client = page._client;
  await client.send('Page.enable');
  await client.send('DOM.enable');
  await client.send('CSS.enable');

  //Start tracking CSS coverage
  await client.send('CSS.startRuleUsageTracking');

  //Add this event to be notified whenever a stylesheet is added
  //(payload contains the stylesheet size which is needed to calculate the percentage)
  const stylesheets = [];
  client.on('CSS.styleSheetAdded', stylesheet => {
    stylesheets.push(stylesheet.header);
  });

  //Trigger the user interaction with the page to hit more CSS rules
  //(in our case this means trigger clicking on each fo the tabs)
  const url = 'https://unused-css-example-site-qijunirqpu.now.sh';
  await page.goto(url);
  await page.click('.tab.type2');
  await page.click('.tab.type3');
  await page.click('.tab.type4');

  //Stop tracking CSS and get `ruleUsage` data object
  const { ruleUsage } = await client.send('CSS.stopRuleUsageTracking');

  //You can see how `calcUnusedCssPercentage` is implemented here:
  //https://github.com/cowchimp/headless-devtools/blob/17398336400eae3a7088069f1a27639c2ad30ac2/src/calcUnusedCss/index.js#L25
  //(not shown here for brevity and because it's just in-memory math operations)
  const unusedCSS = calcUnusedCssPercentage(stylesheets, ruleUsage);

  console.log(`${unusedCSS}% of your CSS is unused`);

  await browser.close();
}
If you want to use this script for your site, it's available as an NPM module and the full source-code is available on github. That version lets you pass the block of user-interaction instructions as an external callback.
Wrap up
So here we have it, a script that can calculate the real percentage of unused CSS in our app. The output of running this would be 15% of your CSS is unused.
Keep in mind that this is just one example of a common DevTools action that useful and easy be automate. The next time you get something done with DevTools, ask yourself if it makes sense to automate it, and how much time this will save down-the-line.
If you have any questions or need some advice on tinkering with the DevTools Protocol, feel free to reach out on twitter.
Lighthouse has a built-in audit that measures the amount of unused CSS but unless you extend Lighthouse it won't take user interaction into account. ↩︎
Another way would be to just look for the relevant command in the official DevTools Protocol documentation site. ↩︎
You can do this by finding the location of the Chrome executable on your machine and using your Terminal\CLI to pass the extra flag (e.g. on my mac it's located at
/Applications/Google\ Chrome.app/Contents/MacOS/Google\ Chrome) ↩︎You might want to clear all WebSocket messages in DevTools #2 prior to performing the action in DevTools #1 ↩︎
A big thanks to Konrad Dzwinel for sharing this technique. ↩︎
Puppeteer lets you do that but it involves passing DevTools Protocol commands as strings. If this concerns you, consider using chrome-remote-interface instead. ↩︎

